Description
This is the first TradingView indicator EVER to include dynamic support and resistance lines from upper or lower diagonal highs and lows in real-time.
Note: This indicator has been built using Pinescript V2.
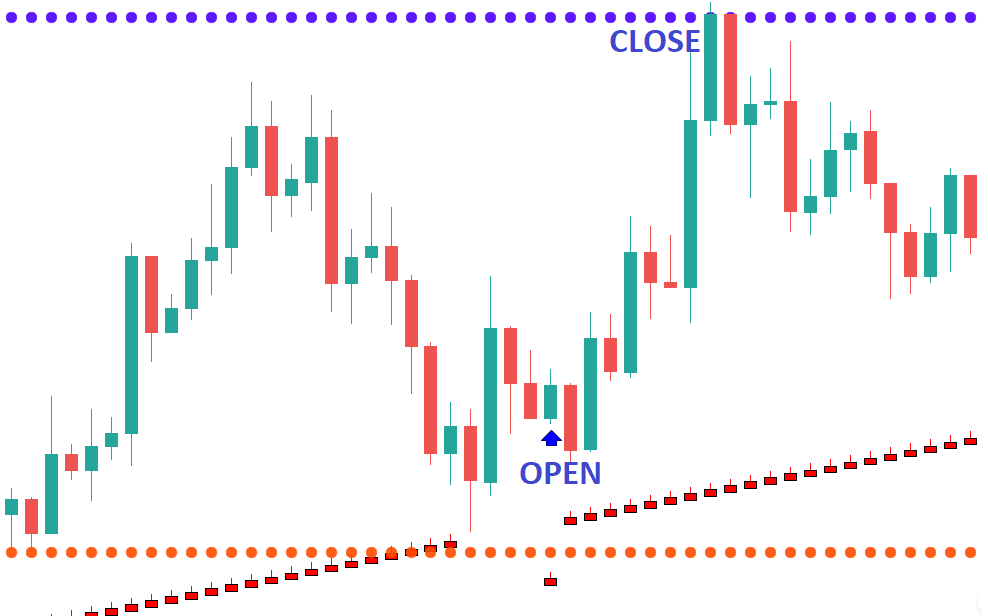
A blue arrow appears only in a red bar and under these conditions:
Closing Score Trigger (CS < 50)
On Balance Volume, Accumulation/Distribution, and Chaikin Money Flow Combination (OBV/AD /CMF > 0)
Chaikin Money Flow (CMF <-0.05)
A blue horizontal line will be drawn when CMF > 0.05 indicates a sale of the position.
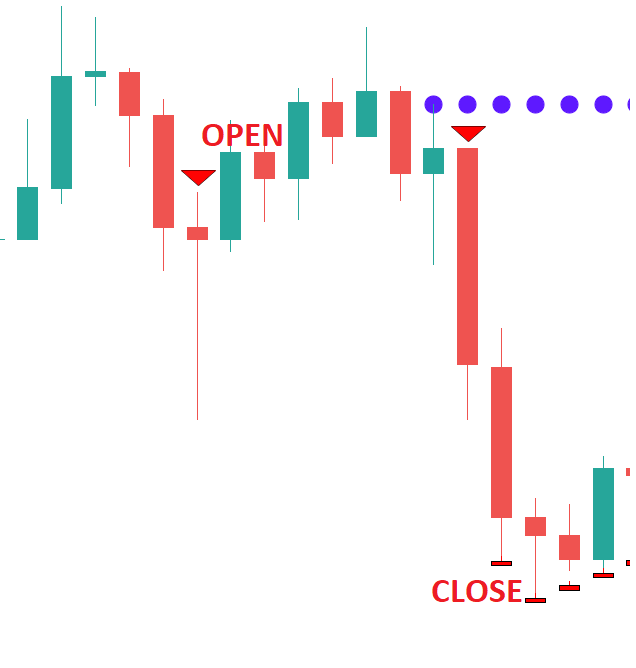
A red arrow appears only in a green bar and under these conditions:
Closing Score Trigger (CS > 50)
On Balance Volume, Accumulation/Distribution, and Chaikin Money Flow Combination (OBV/AD/CMF < 0)
Chaikin Money Flow (CMF > 0.05)
A red horizontal line will be drawn when CMF <-0.05 indicates a sale of the position.

A new condition called “leaniency” has been added that allows all these conditions to be fulfilled within multiple bars so that the occurrence occurs more frequently. This will result in more signals appearing. Setting leaniency to “1” means that all four conditions must occur in a single bar, while “5” means that all four conditions must occur within 5 bars.