Introduction
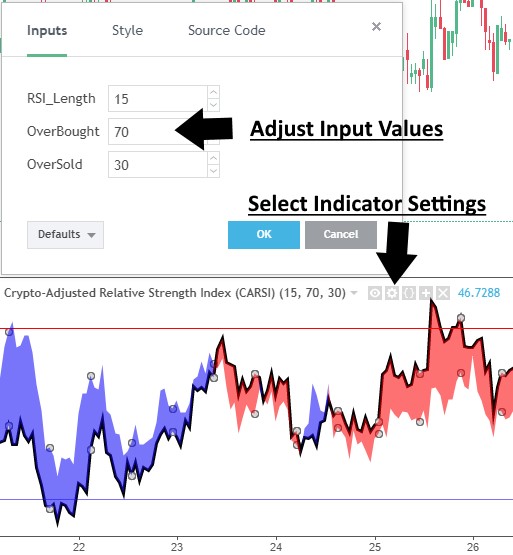
Thank you for purchasing an indicator or bundle from Kenzing®. This brief introduction contains instructions on how the indicator functions and how to adjust the input values that allow you to personalise the indicator according to your trading strategy. Information on how to access the indicator after purchase is not included in this document and can be found in the Read Me FAQ document.
Understanding the Crypto-Adjusted Relative Strength Index (CARSI)
This relative strength index (RSI) can be adjusted to give weight to the performance of the six largest cryptocurrencies by market-cap. Each of the six cryptocurrencies in this Crypto-Index are weighted equally.
- Bitcoin (BTC)
- Ethereum (ETH)
- Bitcoin Cash (BCH)
- Ripple (XRP)
- Litecoin (LTC)
- Nem Coin (XEM)
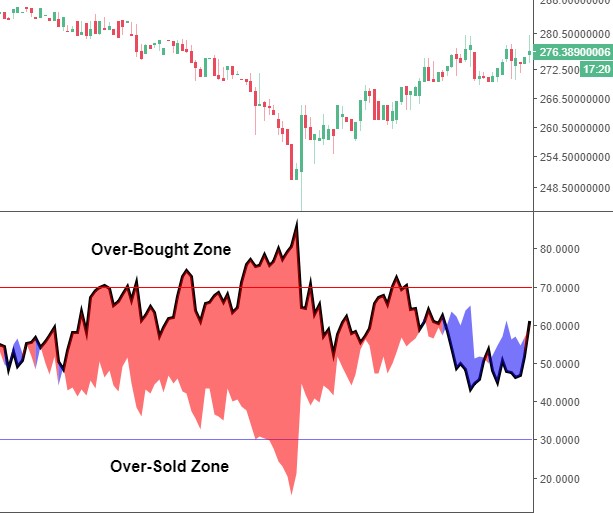
The use of this indicator is to observe the deviation between the RSI of the underlying asset that is the basis of your chart, and the rest of the cryptocurrency market that is represented by the Crypto-Index.
A normal RSI takes the average gain, divided by the loss of an asset over a defined period to render a trend line that fluctuates within a measured range. If more cryptocurrencies trend down, while the observed currency trends up, the CARSI will sit lower than the RSI and a blue pool will become visible showing that the chart is outperforming the Crypto-Index listed above.

Inversely, if more cryptocurrencies trend up, while your observed currency trends down, the CARSI will sit higher than the RSI and a red cloud will form, showing that the chart is performing worse than the Crypto-Index.


