Introduction
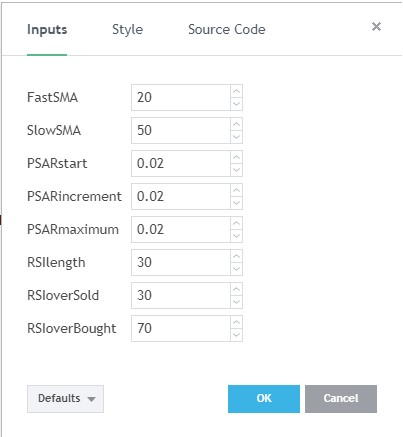
Thank you for purchasing an indicator or bundle from Kenzing®. This brief introduction contains instructions on how the indicator functions and how to adjust the input values that allow you to personalise the indicator according to your trading strategy. Information on how to access the indicator after purchase is not included in this document and can be found in the Read Me FAQ document.
Understanding the Power Bars
This technical indicator only appears when three conditional indicators have been met. The three conditional indicators are as follows:
1. Relative Strength Index (RSI)
2. Parabolic Stop and Reverse (PSAR)
3. Moving Average Convergence Divergence (MACD)
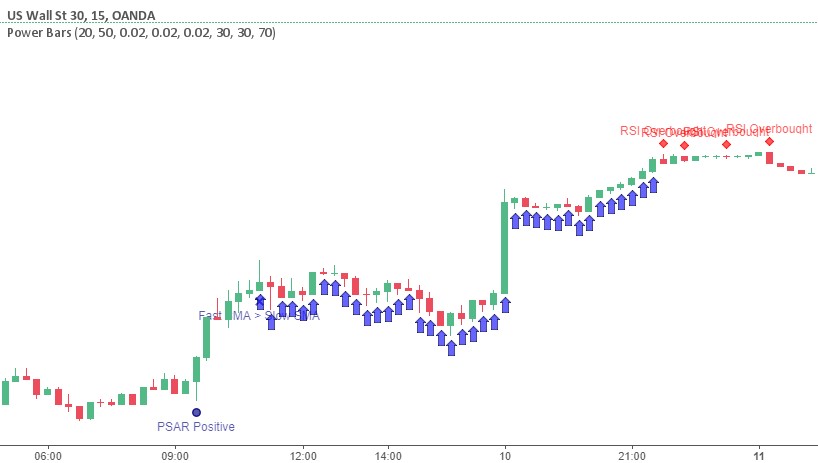
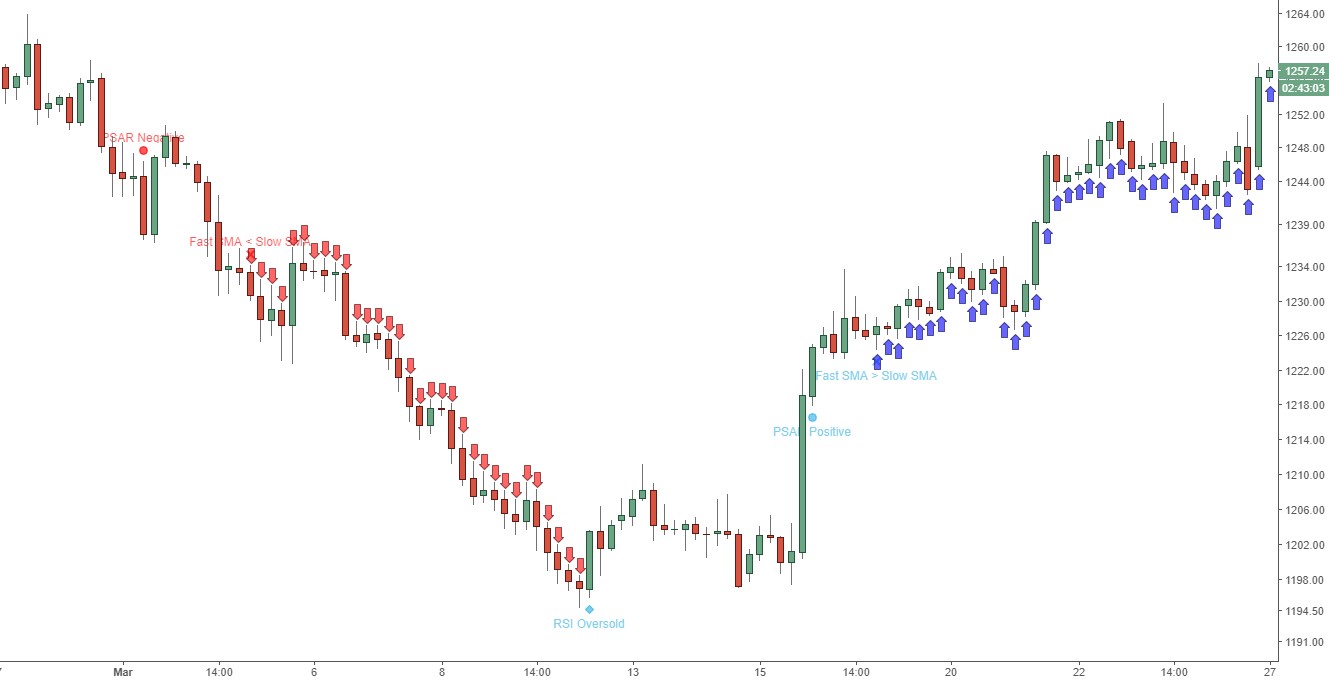
When all three of these indicators indicate a move upwards, a bullish interpretation is assumed, and blue power bars appear below the candlesticks, pointing upwards in the direction of the momentum.

Inversely, when all three of these indicators indicate a downward move, a bearish interpretation is assumed, and red power bars appear above the candlesticks, pointing downward in the direction of the momentum.


