Introduction
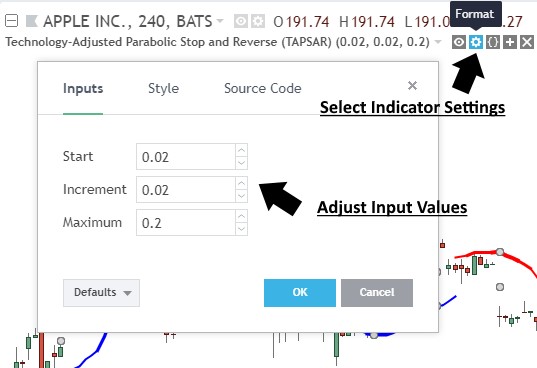
Thank you for purchasing an indicator or bundle from Kenzing®. This brief introduction contains instructions on how the indicator functions and how to adjust the input values that allow you to personalise the indicator according to your trading strategy. Information on how to access the indicator after purchase is not included in this document and can be found in the Read Me FAQ document.
Understanding the Technology-Adjusted Parabolic Stop and Reverse (TAPSAR)
PSAR calculations on each of the six large technology companies listed below are monitored.
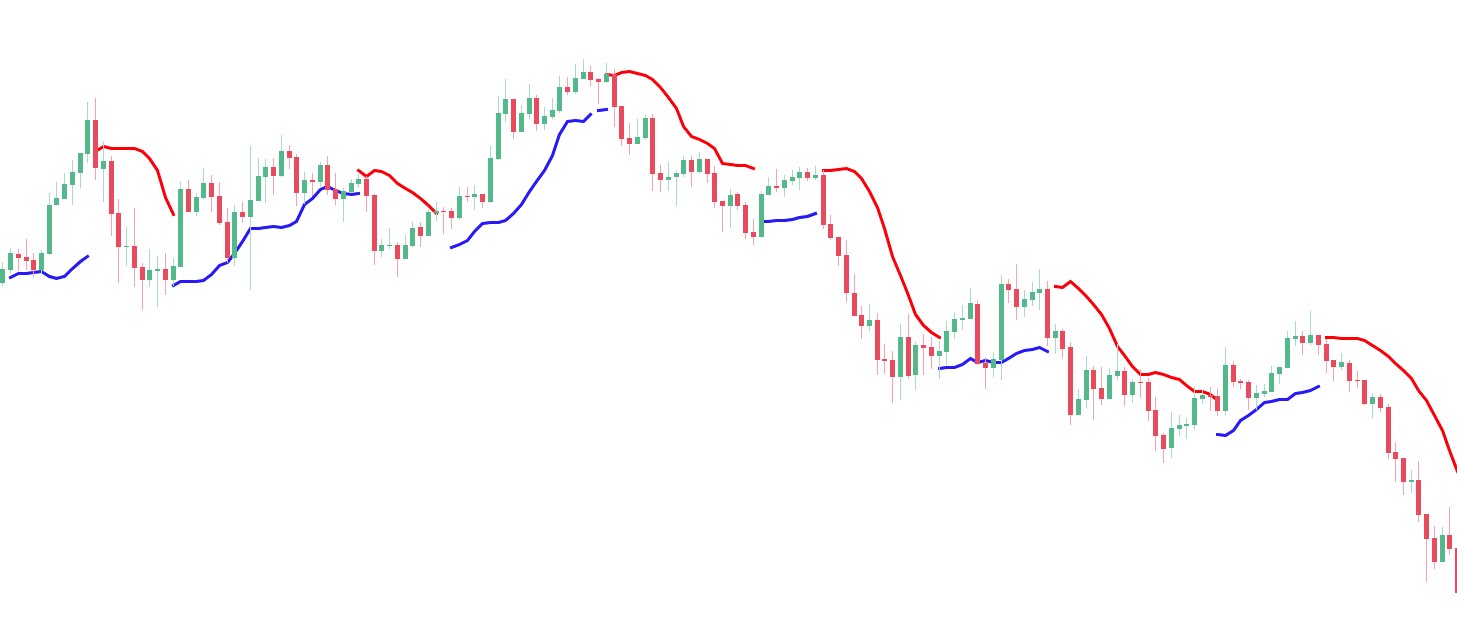
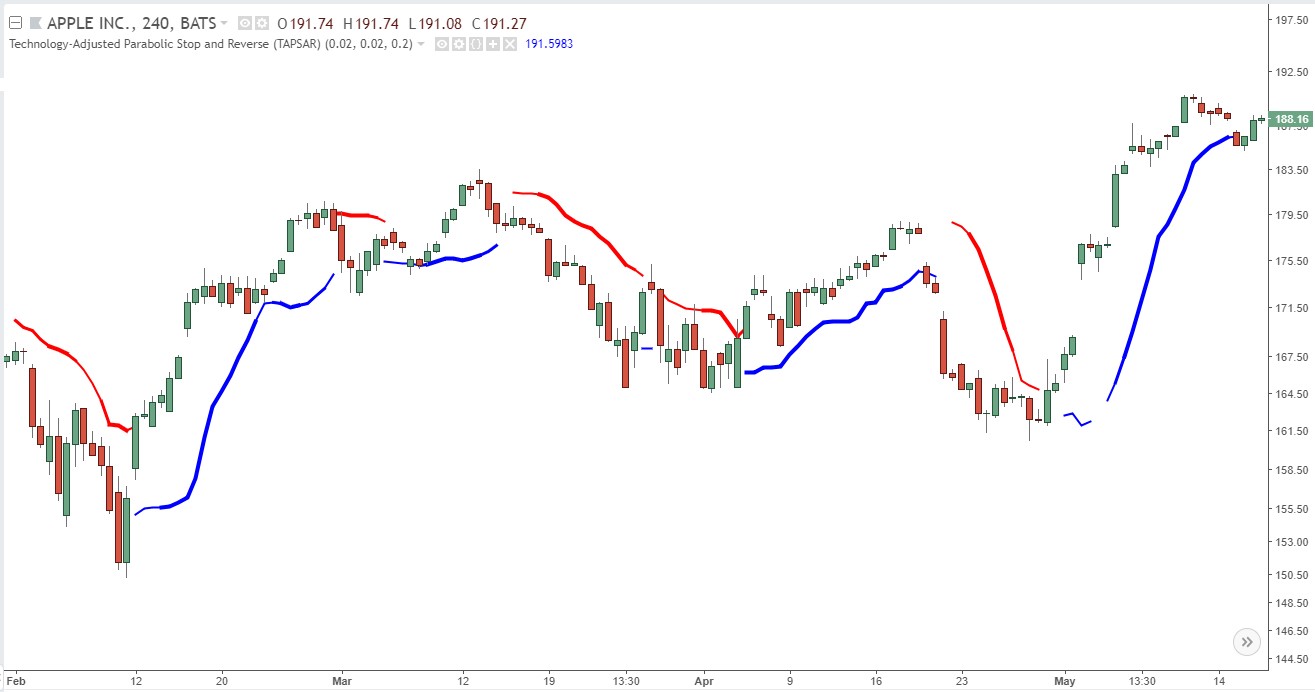
The TAPSAR will appear and stay visible when most of the monitored stocks in the Technology-Index conform in the same sentiment. Each of the six stocks are weighted equally.
1. Apple Inc (NASDAQ:AAPL)
Market Cap: $888.06B
Subsector: Computer Manufacturing
2. Alphabet Inc (NASDAQ:GOOGL)
Market Cap: $738.53B
Subsector: Computer Software: Programming, Data Processing
3. Microsoft Corporation (NASDAQ:MSFT)
Market Cap: $654.81B
Subsector: Computer Software: Prepackaged Software
4. Facebook Inc (NASDAQ:FB)
Market Cap: $529.9B
Subsector: Computer Software: Programming, Data Processing
5. Oracle Corporation (NASDAQ:ORCL)
Market Cap: $204.54B
Subsector: Computer Software: Prepackaged Software
6. International Business Machines Corporation (NASDAQ:IBM)
Market Cap: $141.16B
Subsector: Computer Manufacturing
The use of this indicator is to minimize the impact of market noise on the occurrence of the PSAR signal by including the Technology-Index as an element that represents the technology market.
“Used in the context of equities, noise signifies market activity caused by program trading, dividend payments or other phenomena that is not reflective of overall market sentiment. In this context, it is also known as “market noise.” – Excerpt courtesy of Investopedia®

